Regional Economic Inequalities and Deprivation
The Irish Sea Rim is a region defined by connection. It is a cohesive economic, cultural, and ecological unit, bound together by centuries of trade, migration, and shared heritage. It is home to world-class universities and innovative businesses in sectors from life sciences to advanced manufacturing. Immense potential in renewable energy positions the Irish Sea region as potential global leader. However, beneath the positive story of high economic growth and innovation lies a story of deep and persistent inequality.
A. REGIONAL ECONOMIC INEQUALITIES AND DEPRIVATION
The defining challenge across the Irish Sea region is that of a ‘dual economy’. Within the cities of Glasgow, Manchester, Liverpool, Bristol, Cardiff, Belfast, Dublin, and Cork, dynamic high-growth, knowledge-based sectors are thriving. Yet within the areas which surround these cities lie some of the most deprived communities in Western Europe. The growth and prosperity generated from high-tech and high-finance sectors is not reaching the people in post-industrial towns, overlooked urban areas, and coastal villages, and may be exacerbating economic inequalities. Figures 18.1, 18.2, 18.3, 18.4, and 18.5 show the distribution of deprivation in local authorities and regions in England and Wales, Scotland, Northern Ireland, and Ireland.
In England, Liverpool is ranked as the 3rd most deprived local authority, while the neighbouring borough of Knowsley is ranked 2nd[93]. In 2019 Blackpool was rated the most deprived lower-tier authority in Lancashire[94]. Despite Manchester being one of the fastest growing regions in the UK, deprivation is a majority experience rather than a localised problem, with over half the city’s geographical area thought to fall within England’s most deprived decile[95]. This pattern is repeated across the Irish Sea region. In Bristol, 15.6% of the population resides in the most deprived 10% of areas in England[96]. Belfast exhibits what has been described as a "low-skill, low-pay trap", alongside high levels of household indebtedness, with the city's minority ethnic and migrant communities facing acute challenges in securing adequate housing and employment[97]. In Wales, Cardiff has the largest absolute number of young children (6,600) living in income deprivation in the country, and there are stark contrasts between affluent areas and deprived areas[98].
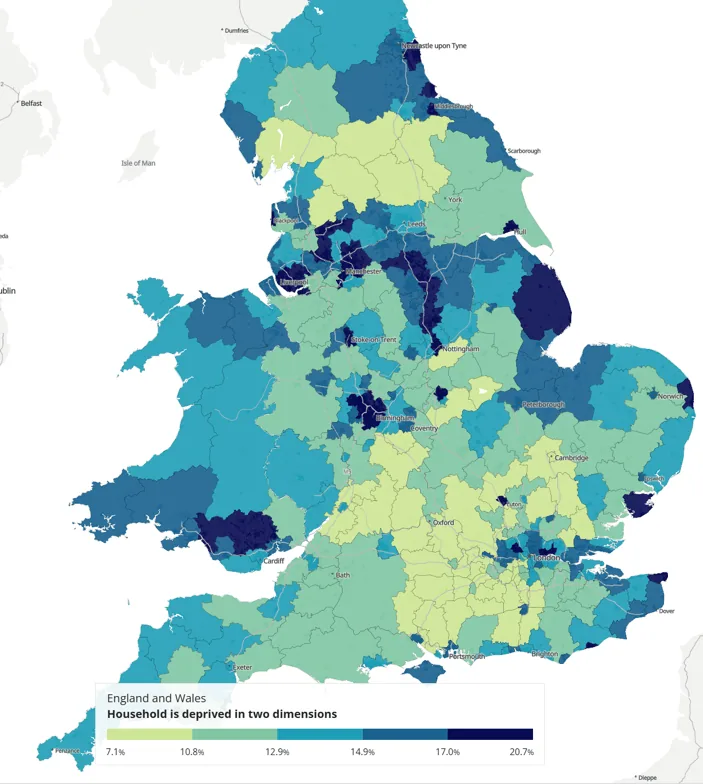 Figure 18.1: Geographical map of indices of deprivation in England and Wales[99]
This map shows that a majority of Local Authorities in the Irish Sea Rim area have 13% or more households that are deprived in two of the four dimensions of deprivation (Education, Employment, Health, and Housing). The most deprived areas (with 15% or more households) are shown in Figure 17.2.
Figure 18.2: Most deprived areas within the England and Wales Irish Sea Rim area
North West | North East | Wales |
Copeland | Sunderland | Denbighshire |
Barrow | Gateshead | Conwy |
Blackpool | Newcastle Upon Tyne | Wrexham |
Preston | County Durham | Pembrokeshire |
Wyre | Hartlepool | Carmarthenshire |
Sefton | Stockton-on-Tees | Swansea |
Blackburn with Darwen | Middlesbrough | Neath Port Talbot |
Ribble Valley | Redcar and Cleveland | Merthyr Tydfil |
Hyndburn | Yorkshire & Humber | Caerphilly |
Burnley | Bradford | Blaenau Gwent |
Bolton | Barnsley | Torfaen |
St. Helens | Wakefield | Bridgend |
Knowsley | Rotherham | Rhondda Cynon Taf |
Liverpool | Sheffield | Newport |
Manchester | Doncaster | West Midlands |
Tameside | Kingston-Upon-Hull | Telford and Wrekin |
Oldham | Scarborough | Newcastle-under-Lyne |
Rochdale | South West | Stoke-on-Trent |
Pendle | Plymouth | Wyre Forest |
Kirklees | Torbay |
Figure 18.3: Geographical map of deprivation in Scotland[100]
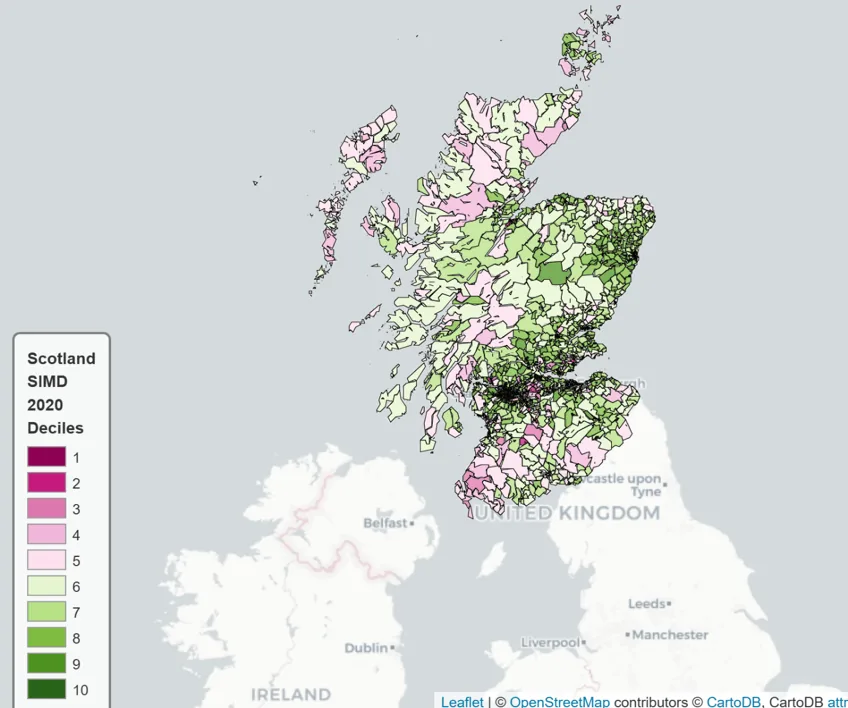 This map shows the geographical distribution of Scotland’s deprivation and is based on analysis of all the individual measures of deprivation. These include health, income, education, employment, housing, access (rural services and isolation) and crime. The most deprived zones are depicted in purple and the least deprived zones in green with the zones being grouped into decile ranges. The map indicates that the top 40% of areas suffering multiple forms of deprivation lie in Highland, the Western Isles, Ayrshire, Dumfries & Galloway and South Lanarkshire.
Figure 18.4: Geographical map of deprivation in Northern Ireland[101]
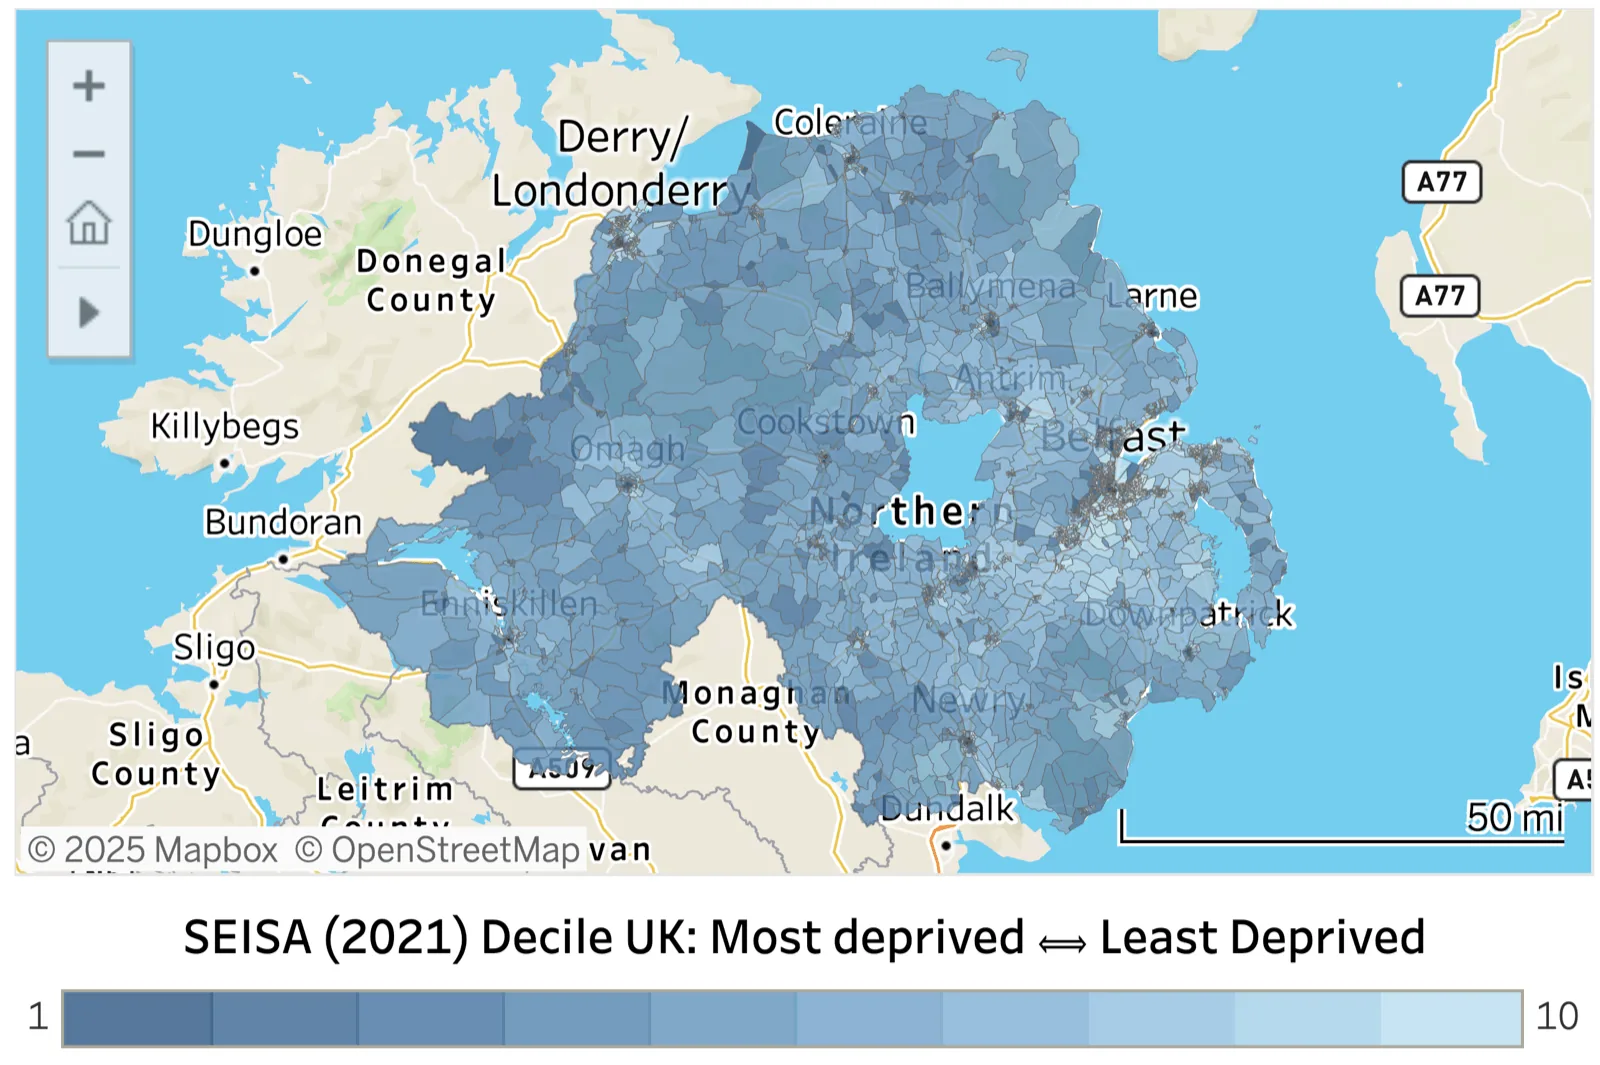
Deprivation in Northern Ireland is intensely concentrated in specific urban pockets, with the Belfast City and Derry City and Strabane council areas containing over half of the most deprived zones. Within these cities, deprivation is hyper-localised; for example, areas in North and West Belfast (such as the Shankill and Falls roads areas) and in Derry-Londonderry (such as the Brandywell and Creggan) consistently rank as the most disadvantaged.
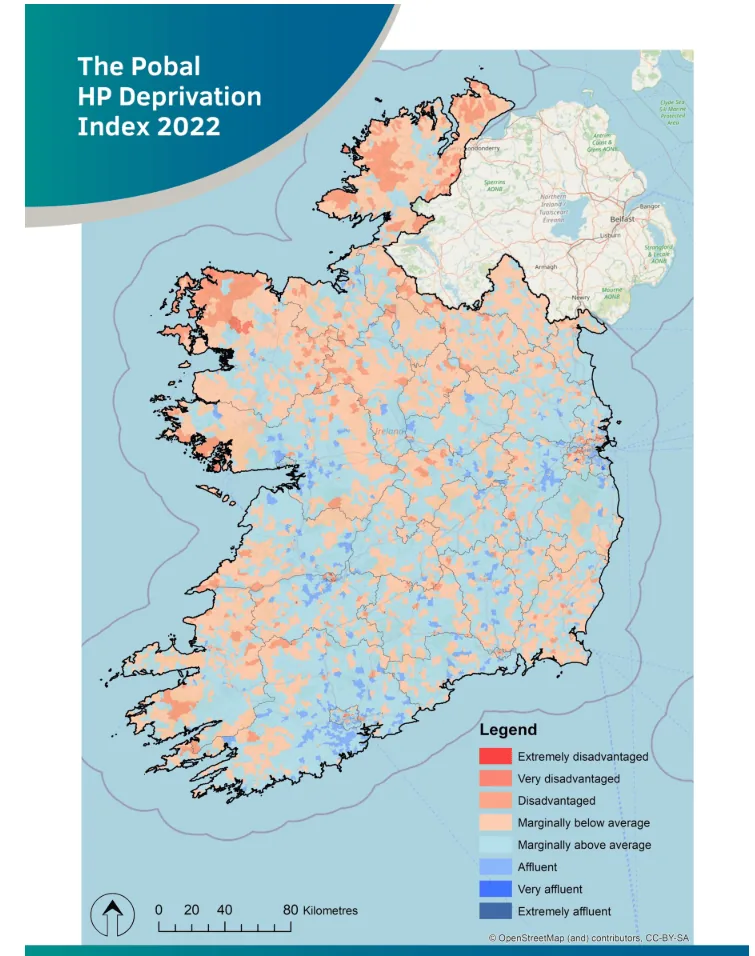
Figure 18.5: Geographical map of deprivation in Ireland[102]
This map shows that the majority of the most deprived areas lie along the coasts. The Pobal HP Deprivation Index uses data from Census 2022, analysing ten measures of an area’s levels of disadvantage. These include educational attainment, employment status and the numbers living in individual households and per room.